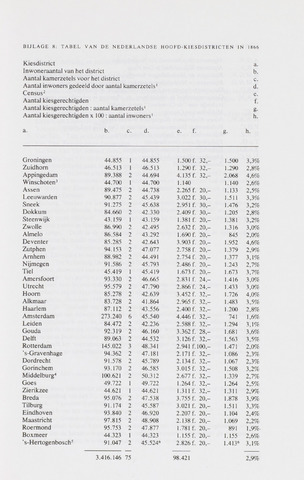
BIJLAGE 8: TABEL VAN DE NEDERLANDSE H OOFD-KIESDISTRICTEN IN 1866
Kiesdistrict a.
Inwoneraantal van het district b.
Aantal kamerzetels voor het district c.
Aantal inwoners gedeeld door aantal kamerzetels1 d.
Census2 e.
Aantal kiesgerechtigden f.
Aantal kiesgerechtigden aantal kamerzetels' g.
Aantal kiesgerechtigden x 100 aantal inwoners' h.
a. b. c. d. e. f. g. h.
Groningen
44.855
1
44.855
1.500 f.
32-
1.500
3,3%
Zuidhom
46.513
1
46.513
1.290 f.
32,-
1.290
2,8%
Appingedam
89.388
2
44.694
4.135 f.
32,-
2.068
4,6%
Winschoten3
44.700
1
44.700
1.140
1.140
2,6%
Assen
89.475
2
44.738
2.265 f.
20,-
1.133
2,5%
Leeuwarden
90.877
2
45.439
3.022 f.
30,-
1.511
3,3%
Sneek
91.275
2
45.638
2.951 f.
30,-
1.476
3,2%
Dokkum
84.660
2
42.330
2.409 f.
30,-
1.205
2,8%
Steenwijk
43.159
1
43.159
1.381 f.
20,-
1.381
3,2%
Zwolle
86.990
2
42.495
2.632 f.
20,-
1.316
3,0%
Almelo
86.584
2
43.292
1.690 f.
20,-
845
2,0%
Deventer
85.285
2
42.643
3.903 f.
20,-
1.952
4,6%
Zutphen
94.153
2
47.077
2.758 f.
20,-
1.379
2,9%
Arnhem
88.982
2
44.491
2.754 f.
20,-
1.377
3,1%
Nijmegen
91.586
2
45.793
2.486 f.
20,-
1.243
2,7%
Tiel
45.419
1
45.419
1.673 f.
20,-
1.673
3,7%
Amersfoort
93.330
2
46.665
2.831 f.
24,-
1.416
3,0%
Utrecht
95.579
2
47.790
2.866 f.
24,-
1.433
3,0%
Hoorn
85.278
2
42.639
3.452 f.
32,-
1.726
4,0%
Alkmaar
83.728
2
41.864
2.965 f.
32,-
1.483
3,5%
Haarlem
87.112
2
43.556
2.400 f.
32,-
1.200
2,8%
Amsterdam
273.240
6
45.540
4.446 f.
32,-
741
1,6%
Leiden
84.472
2
42.236
2.588 f.
32,-
1.294
3,1%
Gouda
92.319
2
46.160
3.362 f.
28,-
1.681
3,6%
Delft
89.063
2
44.532
3.126 f.
32,-
1.563
3,5%
Rotterdam
145.022
3
48.341
2.941 f.
100,-
1.471
2,0%
's-Gravenhage
94.362
2
47.181
2.171 f.
32,-
1.086
2,3%
Dordrecht
91.578
2
45.789
2.134 f.
32,-
1.067
2,3%
Gorinchem
93.170
2
46.585
3.015 f.
32,-
1.508
3,2%
Middelburg4
100.621
2
50.312
2.677 f.
32,-
1.339
2,7%
Goes
49.722
1
49.722
1.264 f.
32,-
1.264
2,5%
Zierikzee
44.621
1
44.621
1.311 f.
32,-
1.311
2,9%
Breda
95.076
2
47.538
3.755 f.
20,-
1.878
3,9%
Tilburg
91.174
2
45.587
3.021 f.
20,-
1.511
3,3%
Eindhoven
93.840
2
46.920
2.207 f.
20,-
1.104
2,4%
Maastricht
97.815
2
48.908
2.138 f.
20,-
1.069
2,2%
Roermond
95.753
2
47.877
1.781 f.
20,-
891
1,9%
Boxmeer
44.323
1
44.323
1.155 f.
20,-
1.155
2,6%
s-Hertogenbosch5
91.047
2
45.524'
2.826 f.
20,-
1.413'
3,1%
3.416.146
75
98.421
2,9%